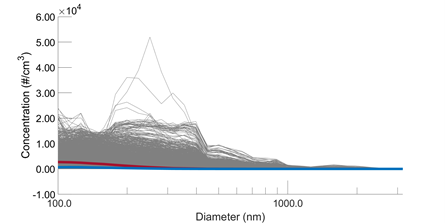
An example of a size distribution plot, where the x-axis represents the diameter of the particles in nanometers and the y-axis represents the number concentration of the aerosols (cm-3). The red and blue lines each represent a cluster, therefore the k-means value for this plot would be two. Since two clusters don’t describe this size distribution, the process would need to be run again with more clusters.